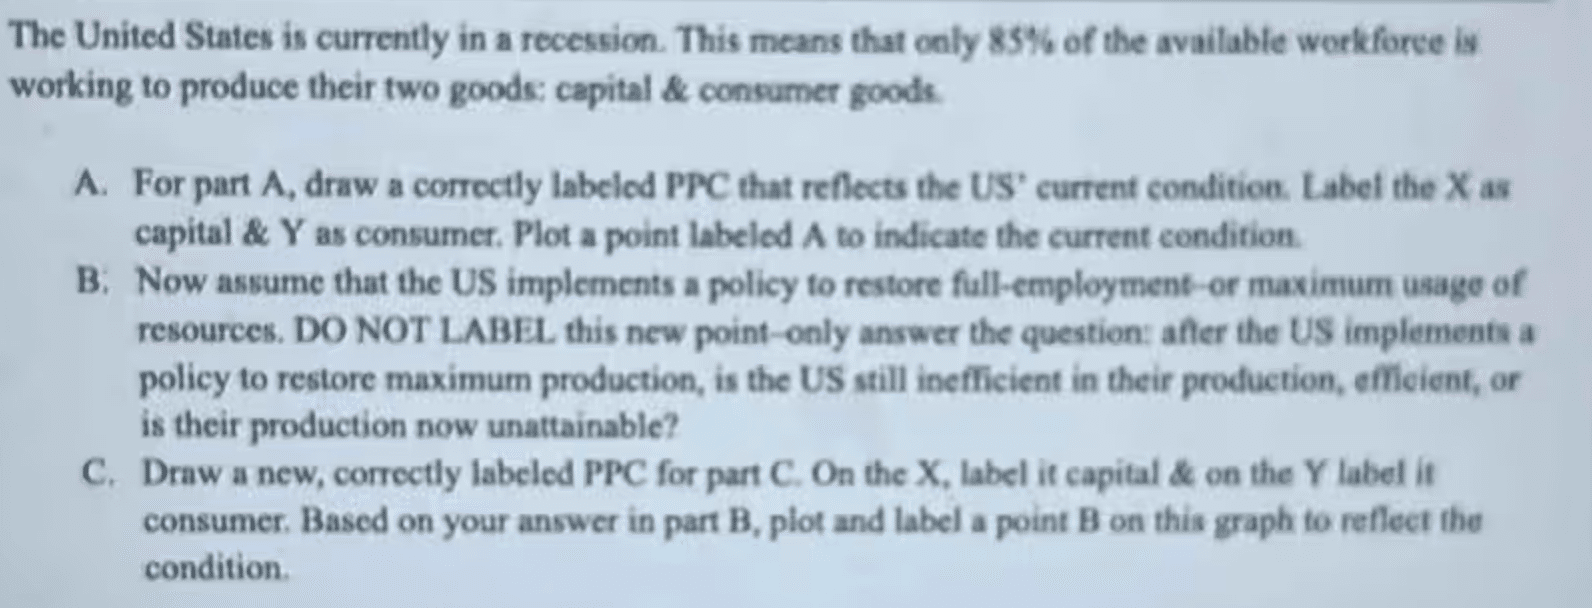
For part A, draw a correctly labeled PPC that reflects the US’ current condition. Label the X as capital & Y as consumer. Plot a point labeled A to indicate the current condition. Now assume that the US implements a policy to restore full-employment—or maximum usage of resources. DO NOT LABEL this new point—only answer the question: after the US implements a policy to restore maximum production, is the US still inefficient in their production, efficient, or is their production now unattainable? Draw a new, correctly labeled PPC for part C. On the X, label it capital & on the Y label it consumer. Based on your answer in part B, plot and label a point B on this graph to reflect the condition.
To answer your question about the Production Possibility Curve (PPC):
Part A: You need to draw a PPC that reflects the current production conditions of the US. Label the X-axis as ‘Capital’ and the Y-axis as ‘Consumer Goods.’ Place point A somewhere inside the curve to indicate inefficiency, as this reflects underutilization of resources.
Part B: If the US implements a policy to restore full employment, this means they are maximizing the use of their resources. Therefore, the production point would move to the PPC curve itself, indicating production is now efficient. So, the answer is that after implementing the policy, the US is efficient in their production.
Part C: For this part, draw a new PPC, still labeled with ‘Capital’ on the X-axis and ‘Consumer Goods’ on the Y-axis. Since the production is now efficient, plot point B on the curve, illustrating full utilization of resources.
In summary, the US goes from an inefficient point (A) inside the PPC to an efficient point (B) on the PPC after the policy implementation. Good luck with your homework, and feel free to reach out for more help!