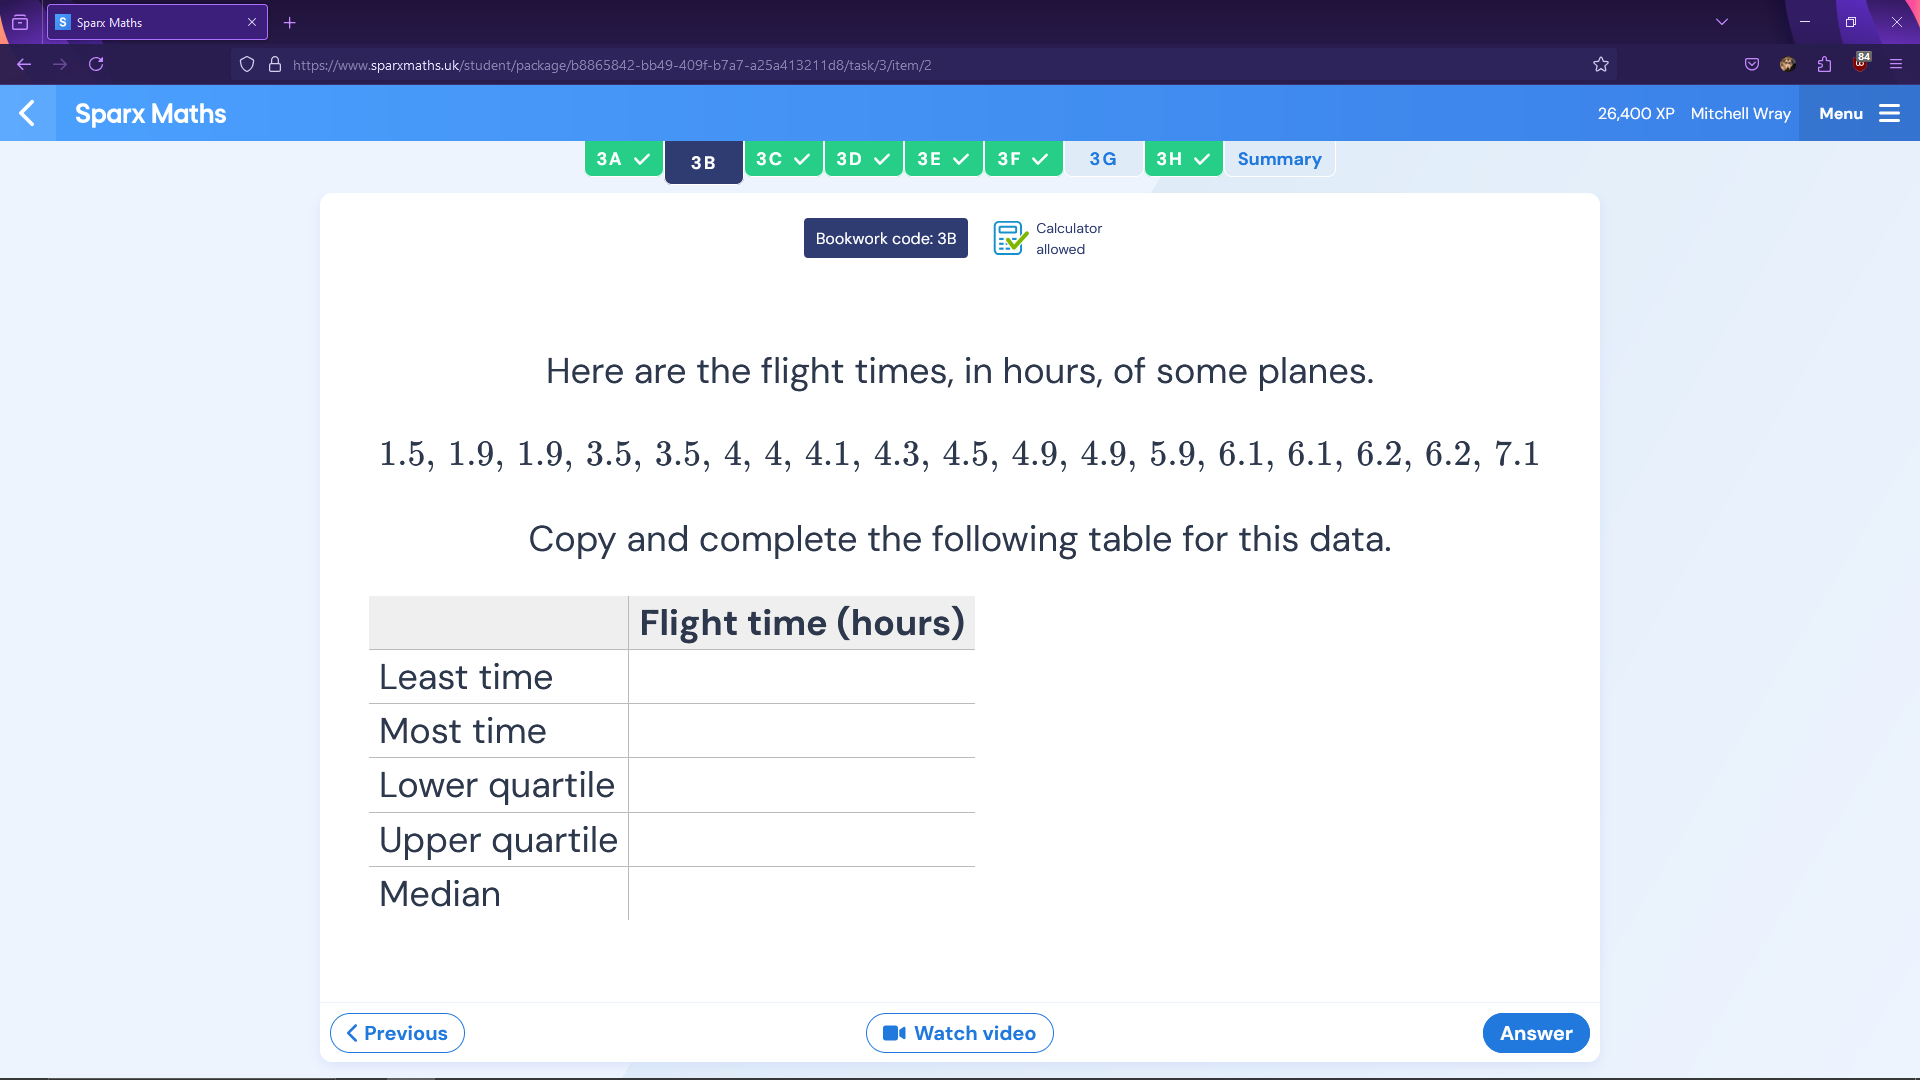
Here are the flight times, in hours, of some planes.
1.5, 1.9, 1.9, 3.5, 3.5, 4, 4, 4.1, 4.3, 4.5, 4.9, 4.9, 5.9, 6.1, 6.1, 6.2, 6.2, 7.1
Copy and complete the following table for this data.
Flight time (hours)
Least time
Most time
Lower quartile
Upper quartile
Median
To complete the table for the given flight times, we need to find the least time, most time, lower quartile (Q1), upper quartile (Q3), and median. Let’s go through these step by step.
1. Least time: This is the smallest value in the set.
– Least time = 1.5 hours
2. Most time: This is the largest value in the set.
– Most time = 7.1 hours
3. Median: This is the middle value when the data is sorted.
– When sorted: 1.5, 1.9, 1.9, 3.5, 3.5, 4, 4, 4.1, 4.3, 4.5, 4.9, 4.9, 5.9, 6.1, 6.1, 6.2, 6.2, 7.1
– Since there are 18 values (even number), the median is the average of the 9th and 10th values:
– Median = (4.3 + 4.5) / 2 = 4.4 hours
4. Lower Quartile (Q1): This is the median of the first half of the data (lower 9 values).
– Lower half:
To analyze the flight times and complete the table, we’ll first sort the data and identify the key statistical measures. Here are the sorted flight times:
1.5, 1.9, 1.9, 3.5, 3.5, 4, 4, 4.1, 4.3, 4.5, 4.9, 4.9, 5.9, 6.1, 6.1, 6.2, 6.2, 7.1
Now, let’s find each value:
1. Least time: This is the smallest value in the dataset.
– Least time = 1.5
2. Most time: This is the largest value in the dataset.
– Most time = 7.1
3. Median: To find the median, we locate the middle value. Since there are 18 data points (even number), the median will be the average of the 9th and 10th values.
– 9th value = 4.3
– 10th value = 4.5
– Median = (4.3 + 4.5) / 2 = 4.4
4. Lower quartile (Q1): This is the median of the first half of the data (the first 9 values