Escolha o diagrama que melhor representa a relação entre os grupos abaixo:
CAMISETAS
COISAS VERMELHAS
GIRASSÓIS
1
2
3
4
5
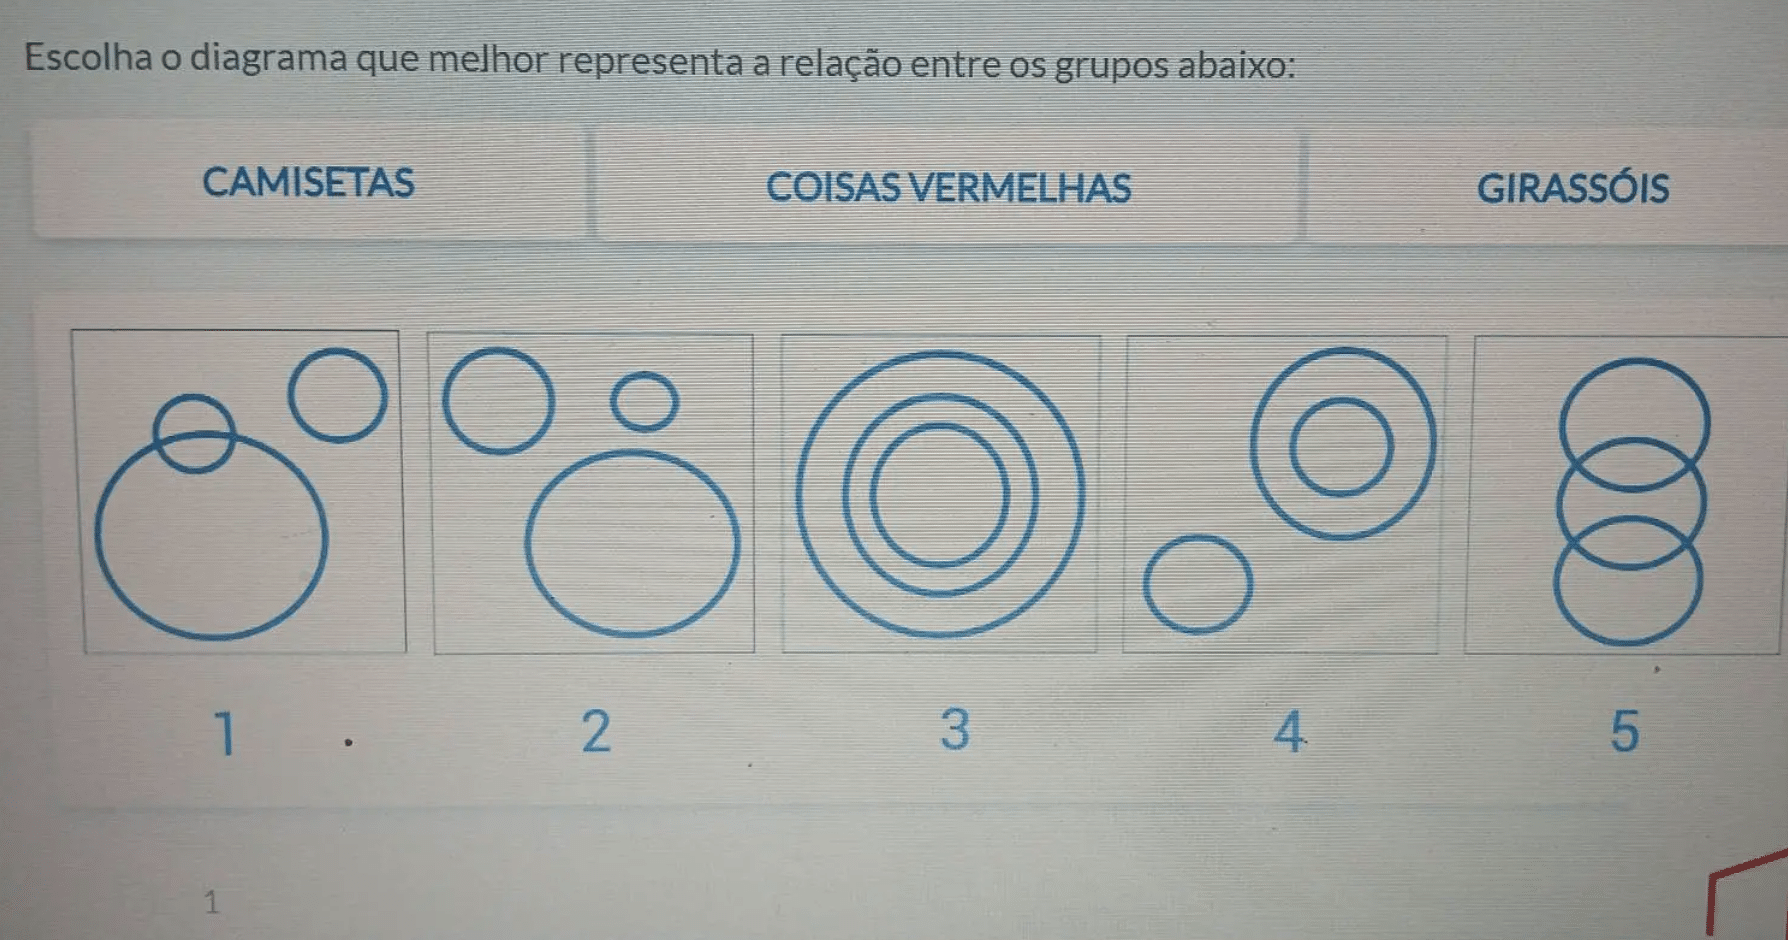
Escolha o diagrama que melhor representa a relação entre os grupos abaixo:
CAMISETAS
COISAS VERMELHAS
GIRASSÓIS
1
2
3
4
5
To choose the best diagram representing the relationship among “CAMISETAS” (T-shirts), “COISAS VERMELHAS” (red things), and “GIRASSÓIS” (sunflowers), you’d typically look for a Venn diagram that accurately depicts how these groups intersect.
1. CAMISETAS can be of various colors, including red.
2. COISAS VERMELHAS can encompass a wide range of items, including red T-shirts.
3. GIRASSÓIS can also be red in some varieties but are primarily yellow.
In a Venn diagram, you’d want to show that while T-shirts can be part of red things, and red sunflowers could exist, not all red things are T-shirts or sunflowers.
The best diagram would show overlapping sections indicating these relationships. If you have the diagrams available (numbered 1 to 5), look for one that illustrates these overlaps effectively.
I encourage you to think about which diagram best represents the shared characteristics among these three categories! If you want more in-depth help, check the extended services page for additional assistance.